In the final lab of GIS 2 I worked within Trempealeau County to determine sand mining suitability as well as sand mining impact in the form of environmental and cultural risk. To perform this project I had to create a suitability model of the land and create an impact on the environment model as well. I used the DEM form Lab 5 as well as using the land cover and geology of the region. In this lab we utilized the Reclassify, Euclidean Distance, Feature to Raster, Slope, Block Statistics, Map Algebra, and Project tool. Then I combined using Map Algebra, suitability, and the impact analysis to determine the most suitable locations for potential sand mines.
Data Sets and Sources:
The data used in this lab was obtained from the USGS, WDNR, USDOT, and Trempealeau county land records.
Data Sets and Sources:
The data used in this lab was obtained from the USGS, WDNR, USDOT, and Trempealeau county land records.
Methods:
Sustainability Model:
Site Criteria for Sand Mining Suitability:
• Geology
• Land Use Land Cover: agricultural (herbaceous planted/cultivated) land use
• Distance to railroads
• Slope
• Water table criteria
The first model I created was the sand mine suitability model. The data I used to determine sand mining suitability were: geologic units, land use/land cover, distance to rail terminals, slope, and water table depth. First, I converted every vector dataset to raster, as it would allow for easier suitability calculations. Next, I determined which criteria were most important for sand mine suitability, and I reclassified each raster to the values between 1-3, with 3 having high suitability and 1 having low suitability (Figure 1).
Figure 1. This table represents the ranks I used in my model and the reasons for which I ranked them
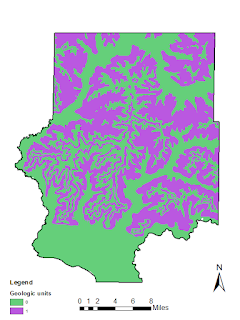
In Figure 2 below there are many different sets of tools each variable had to go through to get to its final stage. In the Geology Class I selected the Jordan and the Wonewoc sandstone formations which are frac sand mines target layers while giving these a 1 while the others get a 0 as they are not targeted by the sand mines.
Figure 2. The model builder that was created for suitability. This includes tools such as euclidean distance, reclassify, and slope tool.
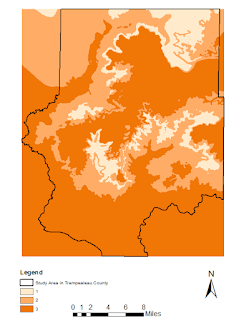
The next 6 maps shown below are all part of the suitability model. The geologic map (figure 3) has either a 0 which means not ideal formation, or a 1 which is an ideal sand formation such as the Jordan or Wonewoc formation for mining. The Land cover map (figure 4) represents the types of fields most suitable for mining frac sand. The distance to rail terminal map (figure 5) represents a less suitable mine the farther away from the terminal in Trempealeau County. The slope map (figure 6) shows that a shallower slope will be more suitable for starting a frac sand mine. The last suitability map is the depth to water table (figure 7) which gives us an idea of the shallower depth to water is more suitable to frac sand mining for the high capacity wells. The last map of suitability brings all of these other maps together to find the most suitable locations for a frac sand mine(figure 8).
Figure 3. Geologic map of reclassified suitable frac sand formations.
Figure 4. Land Cover suitability reclassified for suitability.
Figure 5. Distance to railroad reclassified into 3 sections.
Figure 6. Slope map reclassified
Figure 7. Depth to water table map reclassified
Figure 8. Final Suitability Index using the raster calculator tool to find the greatest suitability in the Trempealeau county study area.
Impact Model:
• Proximity to streams
• Prime farmland
• Proximity to residential areas (noise shed and dust shed)
• Proximity to schools (noise shed and dust shed)
• Park areas
The second model I created was the sand mine risk index model. The data I used to determine sand mining risks were: distance to streams, impact on prime farmland, distance to populated areas, distance to schools, risk of groundwater contamination, and aesthetic implications on parks and trails. Next, I converted every vector dataset to raster, and reclassified each raster to the values between 1-3. All of the data for the Impact model and my reasoning are shown below in figure 9.
Figure 9. This table shows the five variables used in the model and how and why they were reclassified.
Figure 10. This is the Impact model I constructed in model builder using multiple tools such as euclidean distance, reclassify, and raster calculator.
The next 6 maps below are from the impact model that I had built in model builder. The Stream proximity map (figure 11) to show the lower risk as you move farther from the streams. The prime farm land map (figure 12) represents the high producing farmland so that mines are not being created on these great agricultural areas. The residential map (figure 13) shows areas situated farther from high populations will have lower impacts on the surrounding population. The schools map (figure 14) gives an idea of how far the mine should be located from a school so it will not interfere with younger kids. The map that I was able to chose dealt with the parks in Trempealeau county (figure 15).
Figure 11. Reclassified stream impact
Figure 12. Prime farm land reclassified impact
Figure 13. Reclassified distance to populated areas within 640 m appear in the color green.
Figure 14. Reclassified distances from schools
Figure 15. Reclassified distances from parks in Trempealeau County study area
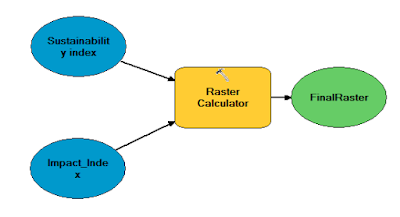
After both models were created, I used raster calculator to overlay the results of the two models (figure 16). The map (figure 17) shows where the most optimal frac sand mine locations in the southern part of Trempealeau county would be located. The green represents where low suitability areas are where as the red represents higher suitability areas are.
Figure 16. Final raster calculation using both the suitability and impact models in model builder.
Figure 17. Sand mine location analysis of the Trempealeau County, Wisconsin study area for most suitable land to start a sand mine.
After the suitability and impact model were created, I had to find an area that would be considered a prime recreational area. The map I created below (figure 18) using the wildlife points in the county did not seem to generate a very large amount of high value recreational area. In this map I used the viewshed tool to determine if any suitable mining locations would be visible from the location.
Figure 18. Map of a high recreational area from wildlife points in the county with the green representing visible and the pink not visible.
Conclusion:
In Figure 17, we are finally able to tie everything together on one view of Trempealeau County. Being able to use all of the different tools really puts in perspective how many objects really go into making a model and deciding on a location to put something new. I know that if this was a real model there would be even more variables to consider than just the few that we used. I also see now how easy it is for someone to mess around with the reclassify tool and get a completely different map than what I currently have. Unfortunately one of the problems I could not understand is why some of my maps would clip to the Trempealeau County boundary but others did not. However I was able to produce my final map within the correct area which makes it much more pleasing to the eye.


No comments:
Post a Comment